
Website can be closed on 12th to 14th Jan 2025 due to server maintainance work.
Assignment: Unveiling Lissajous Figures – Derivation, Visualization, and Applications
Introduction:
The Lissajous figure, a captivating visual representation of the interaction between two sinusoidal waves, offers valuable insights in various scientific and engineering fields. This assignment delves into the concept of Lissajous figures, exploring their derivation, visualization, and diverse applications.
The Essence of Lissajous Figures:
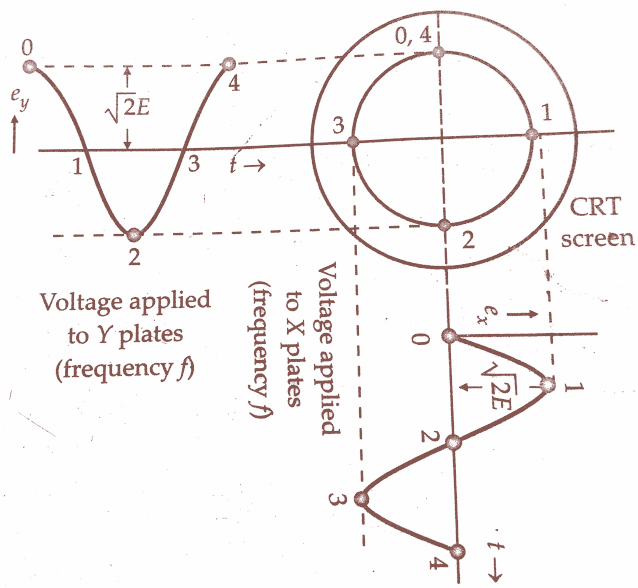
Imagine a cathode ray oscilloscope (CRO) with two sets of deflecting plates. When two independent sinusoidal voltages are applied to these plates, the electron beam within the CRO traces a path on the screen. This path, governed by the combined effect of the two voltages, forms a fascinating pattern known as the Lissajous figure.
Diagram:
Mathematical Derivation:
The mathematical derivation of the Lissajous figure involves analyzing the deflection of the electron beam in the CRO. Here’s a simplified explanation:
- Deflection Equations: Let x(t) and y(t) represent the horizontal and vertical displacements of the electron beam at time t, respectively. These displacements are proportional to the voltages applied to the corresponding deflecting plates. If V₁x(t) and V₂y(t) represent the voltages, we can write:
x(t) = k₁ * V₁x(t)
y(t) = k₂ * V₂y(t)
where k₁ and k₂ are proportionality constants.
- Sinusoidal Inputs: Consider the case where V₁x(t) and V₂y(t) are sinusoidal voltages with different frequencies (f₁ and f₂) and amplitudes (A₁ and A₂):
V₁x(t) = A₁ * sin(2πf₁t)
V₂y(t) = A₂ * sin(2πf₂t + φ)
where φ represents the phase difference between the two voltages.
- Resulting Trajectory: Substituting these expressions into the deflection equations and manipulating them, we can obtain the equations for x(t) and y(t) as functions of time. Plotting these functions together depicts the trajectory of the electron beam, forming the Lissajous figure.
Shape Dependence:
The shape of the Lissajous figure depends on the ratio of frequencies (f₁/f₂) and the phase difference (φ) between the two input voltages. Some common cases include:
- Ellipses: When the frequencies are nearly equal (f₁ ≈ f₂)
- Straight lines: When the frequencies have a simple ratio (e.g., 1:1, 2:1) and the phase difference is 0° or 180°
- Circles: When the frequencies are equal (f₁ = f₂) and the phase difference is 90°
Applications:
Lissajous figures find applications in various fields:
- Signal Analysis: By observing the shape of the Lissajous figure on an oscilloscope, engineers can determine the frequency ratio and phase difference between two unknown signals.
- Frequency Measurement: The Lissajous figure can be used to compare the frequencies of two signals. A specific, stable Lissajous pattern (e.g., a circle) indicates a specific frequency ratio.
- Tuning: Lissajous figures are helpful in tuning musical instruments. By comparing the Lissajous figure of a reference signal with the signal from the instrument, musicians can achieve precise tuning.
Conclusion:
Lissajous figures, born from the interaction of simple harmonic motions, offer a valuable tool for visualization and analysis in various scientific and engineering domains. Understanding their derivation, interpretation, and applications empowers individuals to delve deeper into the world of signals and their interactions.